Introduction
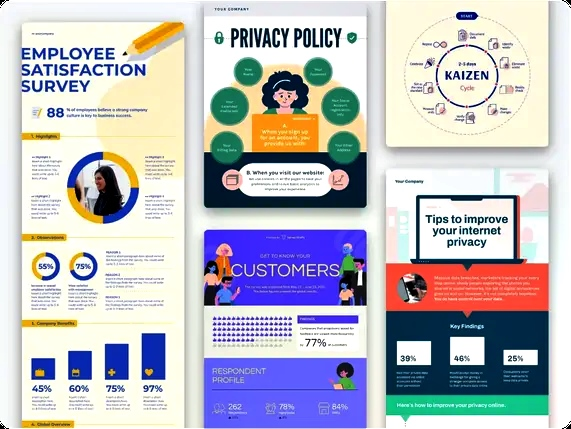
An infographic is a visual representation of information, data, or knowledge designed to present complex information quickly and clearly. The term “infographic” is a combination of “information” and “graphics,” reflecting the primary components of these visual aids. Infographics use a combination of text, images, and graphical elements to convey information in a more engaging and easily understandable format.
The main goals of infographics are to simplify complex concepts, make data more accessible, and enhance overall comprehension. They are often used in various fields, such as journalism, marketing, education, and data analysis, to communicate information effectively.
Five Tools to Create Stunning Infographics
1. Canva

The reigning champion of user-friendliness, Canva boasts an intuitive interface and a massive library of pre-designed templates and elements. Whether you’re a seasoned designer or a complete novice, you’ll find something to get you started.
Strengths:
Unmatched ease of use: Drag-and-drop functionality and a clean interface make it perfect for beginners.
Vast template library: Choose from thousands of professionally designed templates for various topics and styles.
Extensive stock asset collection: Access millions of free photos, icons, and illustrations to enhance your infographics.
Weaknesses:
Limited free plan: While generous, the free plan restricts access to some premium templates and features.
Customization limitations: Templates offer less flexibility compared to dedicated design software.
2. Piktochart
Another user-friendly option, Piktochart provides a solid balance between ease of use and customization. It offers a good selection of templates and editing tools, making it suitable for both beginners and more experienced users.
Strengths:
Intuitive interface: Similar to Canva, Piktochart is easy to navigate and learn.
Decent template library: Find templates for various infographic styles and purposes.
Data visualization tools: Create basic charts and graphs to represent your data visually.
Weaknesses:
Limited free plan: Similar to Canva, the free plan restricts access to some features and premium content.
Fewer design options: Compared to Canva, Piktochart offers a slightly smaller selection of design elements.
3. Visme
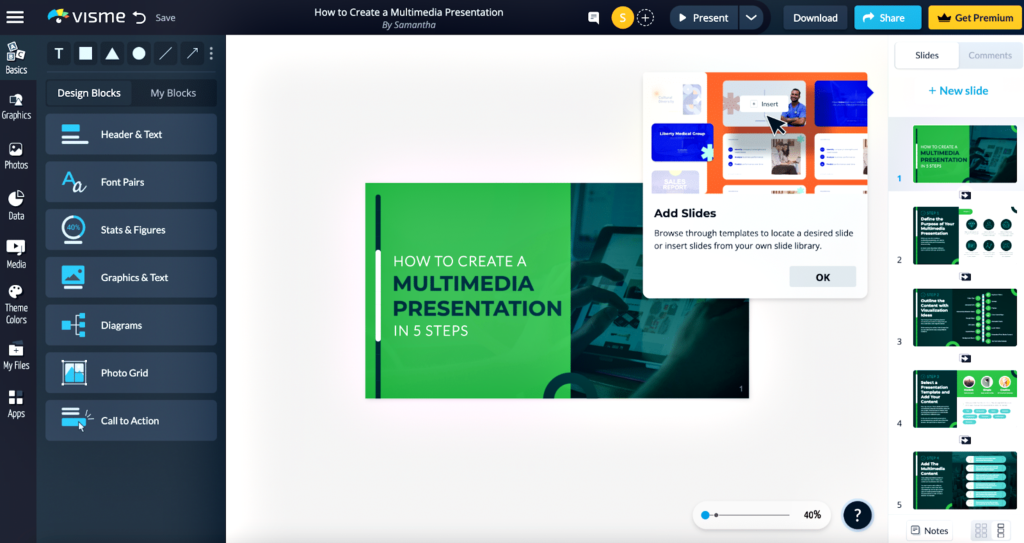
If you’re looking for more advanced features and customization options, Visme steps up to the plate. It offers animation tools, interactive elements, and a wider range of data visualization options.
Strengths:
Advanced features: Create animated infographics, embed interactive elements like maps and quizzes, and leverage extensive data visualization tools.
High-quality templates: Choose from professionally designed templates for various infographic types and industries.
Collaboration tools: Work on infographics with your team in real-time.
Weaknesses:
Steeper learning curve: The advanced features require some familiarity with design concepts.
Limited free plan: The free plan offers fewer features and storage space compared to paid plans.
4. Venngage

Data visualization is Venngage’s specialty. It excels at creating infographics that effectively communicate complex information through charts, graphs, and other visual elements.
Strengths:
Data visualization focus: Offers a wide variety of charts, graphs, and maps to represent your data effectively.
Interactive elements: Make your infographics more engaging with interactive charts, maps, and timelines.
Collaboration tools: Work with your team on creating and editing infographics.
Weaknesses:
Limited design flexibility: Templates offer less customization compared to some other tools.
Data import limitations: Importing large datasets might require upgrading to a paid plan.
5. Easel.ly

If you need a quick and easy way to create basic infographics, Easel.ly is a good choice. Its simple interface and limited features make it perfect for beginners who want to get started without getting overwhelmed.
Strengths:
Extremely easy to use: The drag-and-drop interface is intuitive and requires minimal design knowledge.
Fast and efficient: Create basic infographics quickly with the limited number of available elements and templates.
Free plan with decent features: The free plan offers enough features for creating simple but effective infographics.
Weaknesses:
Limited features and customization: Not ideal for complex infographics or those requiring extensive data visualization.
Smaller template library: Fewer options to choose from compared to other tools on this list.
I hope this will help you to choose the right tool for your infographic creation needs!